


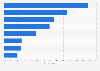

| Characteristic | Share of respondents |
|---|---|
| - | - |
| - | - |
| - | - |
| - | - |
| - | - |
| - | - |
| - | - |
| - | - |
| - | - |
| - | - |
| - | - |
The chart is not accessible to screen readers. Please switch to the table view to access the data.
Download
Source
Source
Release date
March 2024
More information
Region
Japan
Survey time period
March 1 to 3, 2024
Number of respondents
1,110 respondents
Age group
20-69 years
Special properties
video content refers to recorded television programs and content of video streaming services (YouTube, Amazon Prime Video, Netflix, etc.); multiple answers possible
Method of interview
Online survey
Supplementary notes
Blue indicates positive and black indicates negative perceptions, while grey indicates neither of the two.
Citation formats



