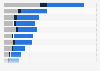
| Characteristic | Not likely | Rather likely | Likely |
|---|---|---|---|
| - | - | - | - |
| - | - | - | - |
| - | - | - | - |
| - | - | - | - |
| - | - | - | - |
| - | - | - | - |
| - | - | - | - |
| - | - | - | - |
The chart is not accessible to screen readers. Please switch to the table view to access the data.
Download
Source
Source
In cooperation with
McKinsey & Company
Release date
September 2022
More information
Region
Worldwide, Australia, Brazil, China, Germany, Italy, Japan, South Korea, United States
Survey time period
2021
Number of respondents
26,000 respondents
Supplementary notes
Minimobility includes electric vehicles that can transport one or two people, are three- or four-wheeled, and fall between a car and a bike. They are often speed-limited to 25 to 90 kilometers per hour, depending on location.
Data reflects answers in response to the question: "How likely are you to consider using a minimobility vehicle as part of your future mobility mix?"
Citation formats