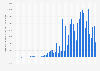
| Characteristic | FDI in billion U.S. dollars |
|---|---|
| 2023 | 81.39 |
| 2022 | 75.42 |
| 2021 | 75.39 |
| 2020 | 84.57 |
| 2019 | 86.37 |
| 2018 | 86.88 |
| 2017 | 81.26 |
| 2016 | 71.56 |
| 2015 | 67.35 |
| 2014 | 63.96 |
| 2013 | 50.72 |
| 2012 | 48.42 |
| 2011 | 45.74 |
| 2010 | 43.1 |
| 2009 | 38.98 |
| 2008 | 30.04 |
| 2007 | 25.91 |
| 2006 | 13.97 |
| 2005 | 7.47 |
| 2004 | 5.82 |
| 2003 | 5.67 |
| 2002 | 4.61 |
| 2001 | 4.66 |
| 2000 | 5.07 |
The chart is not accessible to screen readers. Please switch to the table view to access the data.
August 2024
Spain, United States
2000 to 2023
In accounting, historical cost is the original monetary value of an economic item. Historical cost is based on the stable measuring unit assumption. In some circumstances, assets and liabilities may be shown at their historical cost, as if there had been no change in value since the date of acquisition.
Direct investment implies that a person in one country has a lasting interest in, and a degree of influence over the management of, a business enterprise in another country. For the United States, in accordance with international guidelines, ownership or control of ten percent or more of an enterprise's voting securities, or the equivalent, is considered evidence of such a lasting interest or degree of influence over management. Thus, foreign direct investment in the United States is ownership or control, direct or indirect, by one foreign person of ten percent or more of the voting securities of an incorporated U.S. business enterprise or an equivalent interest in an unincorporated U.S. business enterprise.