

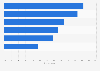
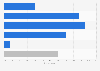

| Characteristic | Operation rate |
|---|---|
| - | - |
| - | - |
| - | - |
| - | - |
| - | - |
| - | - |
| - | - |
The chart is not accessible to screen readers. Please switch to the table view to access the data.
Download
Source
Sources
Release date
June 2025
More information
Region
South Korea
Survey time period
2018 to 2024
Number of respondents
82 institutions*
Supplementary notes
* The survey was conducted among:
18 central administrative agencies
20 local governments
44 public institutions聽
Citation formats



