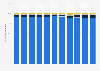
| Characteristic | Excellent | Good | Sufficient | Insufficient | Closed | Not assessed with required frequency, new assessment or with changes |
|---|---|---|---|---|---|---|
| 2013 | 79% | 13% | 6.1% | 0.9% | 1.4% | 0.5% |
| 2014 | 78.8% | 14.9% | 4.1% | 1.4% | - | 0.8% |
| 2015 | 76.3% | 16.9% | 3.5% | 0.3% | - | 3% |
| 2016 | 80.4% | 13.9% | 3% | 0.3% | - | 2.5% |
| 2017 | 82.8% | 10.6% | 3.8% | 0.3% | - | 2.5% |
| 2018 | 85.5% | 8.2% | 4.4% | 0.5% | - | 1.4% |
| 2019 | 86.6% | 8.2% | 3% | 0.8% | - | 1.4% |
| 2020 | 83.5% | 9.6% | 3% | 1.7% | - | 2.2% |
| 2021 | 84.6% | 8.3% | 4.7% | 1.1% | - | 1.4% |
| 2022 | 86.5% | 8.8% | 3% | 1.1% | - | 0.6% |
| 2023 | 87.6% | 7.5% | 3.6% | 0.3% | - | 1.1% |
The chart is not accessible to screen readers. Please switch to the table view to access the data.
Loading statistic...
Download
Source
Source
Release date
May 2024
More information
Region
Germany
Survey time period
2012 to 2022
Supplementary notes
No data for closed coastal swimming areas from 2014.
The source provides no information on figures exceeding 100 percent.
Citation formats