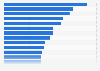
| Characteristic | Male | Female | Non-binary |
|---|---|---|---|
| White | 37% | 62% | 1% |
| Hispanic | 47% | 52% | 1% |
| Black | 49% | 50% | 1% |
| Asian | 37% | 62% | 1% |
| Two or more races | 33% | 65% | 1% |
| American Indian or Alaskan Native | 41% | 58% | 1% |
| Native Hawaiian or Pacific Islander | 62% | 38% | - |
| Middle Eastern | 43% | 57% | - |
The chart is not accessible to screen readers. Please switch to the table view to access the data.
Loading statistic...
Download
Source
Sources
Release date
November 2022
More information
Region
North America
Survey time period
February to April, 2022
Number of respondents
328 museums*
Method of interview
Email survey
Supplementary notes
*Data refer to 30,314 individuals employed by the 328 museums involved in the study. The number of respondents was as follows: White = 17,172; Hispanic = 3,357; Black = 3,110; Asian = 1,933; two or more races = 1,126; American Indian or Alaskan Native = 126; Native Hawaiian or Pacific Islander = 68; Middle Eastern = 35; declined to state = 3,225. The source did not include "decline to state" responses in graphs that analyze the ethnicity.
Missing percentage points to 100 percent are probably due to rounding.
Citation formats