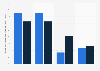
| Characteristic | Sales value in trillion Japanese yen |
|---|---|
| - | - |
| - | - |
| - | - |
| - | - |
| - | - |
| - | - |
The chart is not accessible to screen readers. Please switch to the table view to access the data.
Download
Source
Sources
Release date
October 2022
More information
Region
Japan
Survey time period
fiscal years 2019 to 2021; the Japanese fiscal year starts on April 1 of each stated year and ends on March 31 of the following year
Special properties
market size based on sales at retail logistics businesses
Supplementary notes
*Projection.
**Forecast.
Figures are estimates based on data of the Ministry of Land, Infrastructure, Transport and Logistics (MLIT).
The market size excludes distribution costs as part of item prices or at retailers as part of their own business activities, outsourcing costs to third-parties, and distribution processing by retailers themselves. But processing services by group companies of retailers are included.
100 Japanese yen equal 0.74 U.S. dollars or 0.70 euros as of December 2022.
Values have been rounded.
Citation formats