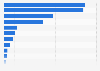
| Characteristic | Share of stolen items |
|---|---|
| Personal items | 26.7% |
| Bicycles/sporting equipment | 15.8% |
| Tools | 15.3% |
| Money, purse, or wallet | 14.3% |
| Personal electronic or audio/visual equipment | 9% |
| Computer equipment | 5.3% |
| Alcohol or food | 4.1% |
| Mobile phone or smartphone | 3.9% |
| Other | 12.2% |
The chart is not accessible to screen readers. Please switch to the table view to access the data.
Loading statistic...
Download
Source
Source
Release date
March 2025
More information
Region
Australia
Survey time period
financial year 2023/24
Special properties
most recent experience of a break-in in the last 12 months
Supplementary notes
Australia's financial year runs from July 1 to June 30 of the stated year; for example, financial year 2024 starts on July 1, 2023 and ends on June 30, 2024.聽
Money, purse, or wallet includes credit card.
Personal items includes handbag, jewelry, clothing, keys, bags, sunglasses etc.
Computer equipment includes tablet, laptop, PC, printer, games consoles etc.
Personal electronic or audio/visual equipment includes smart watch, digital camera, TV, DVD player, stereo etc. Excludes mobile phones and smartphones.
Citation formats