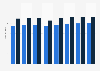
| Characteristic | December 2019 | December 2020 |
|---|---|---|
| - | - | - |
| - | - | - |
| - | - | - |
| - | - | - |
The chart is not accessible to screen readers. Please switch to the table view to access the data.
July 2021
India
2019 to 2020
433,021 households in Dec 2019 and 199,879 households in Dec 2020
One Indian rupee (INR) equals 0.013 U.S. dollars and 0.011 euros (as of October 2021).
The source states: "Estimates for consumption are calculated by dividing household adjusted total expenditure by household size and weighted using member level country weights. Adjusted total expenditure is the sum total of all consumption goods and services purchased by the household during a month, adjusted using weekly records. Real values are adjusted for inflation using the MOSPI CPI (IW) for urban workers and CPI (AL) for rural workers (Base 2012=100). Headcount ratio is the percentage of individuals who are below the poverty line in urban and rural areas in each year. Poverty line is the inflation-adjusted poverty line in rural areas (Rs 972 in 2011-12 prices) and urban areas (Rs 1410 in 2011-12 prices), which are adjusted to 2012 prices with the RBI CPI(AL) and CPI(IW) for 2011/12-2012/13 respectively. All figures are in December 2019 values and observations with missing regions are dropped. Despite a much larger sample in urban areas, the CPHS also underestimates mean per capita consumption in urban areas, likely reflecting their inability to survey high-income urban households. From the draft National Sample Survey Organisation (NSSO) Report on Household Consumer Expenditure for 2017-18, the CPHS estimate of mean per capita consumption in urban areas was 0.8 of the NSSO level for 2017-18. For rural areas, the CPHS estimate is 1.1 of the NSSO level."