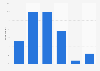
| Characteristic | Share of respondents |
|---|---|
| - | - |
| - | - |
| - | - |
| - | - |
| - | - |
| - | - |
The chart is not accessible to screen readers. Please switch to the table view to access the data.
Download
Source
Source
In cooperation with
Rakuten Insight
Release date
October 2021
More information
Region
Philippines
Survey time period
June 10 to 30, 2021
Number of respondents
8,829 respondents
Age group
16 years and older
Special properties
among 5,989 female and 2,840 male respondents
Supplementary notes
Question was phrased by source as: "How often do you shop for non-grocery items in physical stores?"
Citation formats