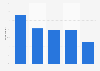
| Characteristic | Office | Industrial | Retail | Multi-family | Hospitality | Healthcare | Other |
|---|---|---|---|---|---|---|---|
| - | - | - | - | - | - | - | - |
| - | - | - | - | - | - | - | - |
| - | - | - | - | - | - | - | - |
| - | - | - | - | - | - | - | - |
| - | - | - | - | - | - | - | - |
| - | - | - | - | - | - | - | - |
| - | - | - | - | - | - | - | - |
| - | - | - | - | - | - | - | - |
| - | - | - | - | - | - | - | - |
| - | - | - | - | - | - | - | - |
The chart is not accessible to screen readers. Please switch to the table view to access the data.
February 2021
Worldwide
October 2019 to September 2020
The source adds the following information: "The 2021 CPE-MHN Top Commercial Mortgage Banking Firms ranking utilized self-reported data for all firms. The ranking is a weighted formula based on a variety of factors, including total origination volume, coverage offered, growth in transaction volume and loan positioning, among others. The ranking represents what we feel is a logical balance between firm growth and market share, as well as sector diversity or specialization. Ranking factors are not limited to the data on this page."
The source does not provide any information regarding missing percentage points to 100 percent.