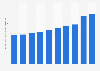
| Characteristic | Government-financed current healthcare expenditure in million GBP |
|---|---|
| All providers | 228,289 |
| Hospitals | 114,547 |
| Offices of general medical practitioners | 20,343 |
| Residential long-term care facilities | 20,191 |
| Providers of medical goods | 18,692 |
| Other ambulatory providers | 18,320 |
| Providers of preventive care | 8,942 |
| Providers of home healthcare services | 11,973 |
| Rest of economy | 4,252 |
| Providers of ancillary services | 4,941 |
| Dental practices | 3,170 |
| Providers of healthcare system administration and financing | 2,575 |
| Rest of the world | 137 |
| Not elsewhere classified | 204 |
The chart is not accessible to screen readers. Please switch to the table view to access the data.
May 2024
United Kingdom
2022
*Figures exclude expenditure on capital, but include consumption of capital.
Figures are provided in nominal terms (current prices), unadjusted for inflation.
Provider (HP) refers to type of organisation that delivers care or services.
Government financing covers healthcare spending by the NHS, local authorities and other government bodies involved in the provision of healthcare. Figures are reported net of client contributions and grants to charities.
The UK Health Accounts are produced according to the System of Health Accounts 2011 framework; a set of internationally standardised definitions for healthcare expenditure. These definitions are broader than those used in other UK analyses, and include some services typically considered social care in the UK.