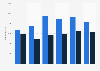
| Characteristic | Decrease by more than 20% | Decrease by 10% to 20% | Decrease by 1% to10% | Stay more-or-less the same | Increase by 1% to 10% | Increase by 10% to 20% | Increase by more than 20% |
|---|---|---|---|---|---|---|---|
| Diagnostics manufacturers | 3% | 3% | 14% | 17% | 28% | 21% | 14% |
| Pharma services (i.e. CRO, CDMO, etc.)/diagnostic lab services | 2% | 6% | 10% | 29% | 29% | 19% | 4% |
| Biopharma | 3% | 13% | 16% | 16% | 29% | 19% | 3% |
| Medical device | - | 13% | 6% | 55% | 6% | 13% | 6% |
| Healthcare IT | 3% | 8% | 13% | 28% | 18% | 27% | 4% |
| Home care and/or hospice | 8% | 11% | 13% | 23% | 23% | 20% | 2% |
| Speciality physician practices | 1% | 14% | 18% | 25% | 23% | 14% | 5% |
| Risk-based physician practices | - | 15% | 20% | 24% | 22% | 15% | 4% |
| Hospitals and health systems | 7% | 17% | 23% | 16% | 14% | 19% | 5% |
| Behavioral health | 15% | 15% | 13% | 26% | 13% | 17% | - |
The chart is not accessible to screen readers. Please switch to the table view to access the data.
Loading statistic...
Download
Source
Source
Release date
March 2021
More information
Region
United States
Survey time period
November 19, 2020, to December 30, 2020
Number of respondents
286 respondents
Special properties
U.S. healthcare and life sciences investment professionals
Supplementary notes
Percentage points missing/exceeding 100 percent are probably due to rounding.
Citation formats