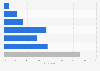
| Characteristic | Share of people |
|---|---|
| - | - |
| - | - |
| - | - |
| - | - |
| - | - |
The chart is not accessible to screen readers. Please switch to the table view to access the data.
Download
Source
Sources
Release date
March 2021
More information
Region
Japan
Survey time period
February 19 to 22, 2021
Number of respondents
1,855 respondents
Method of interview
Online survey
Supplementary notes
Figures represent the share of people who have eaten out, used takeout or delivery services of major restaurant chains since the beginning of the year.
Respondents were from Tokyo and Osaka.
Citation formats