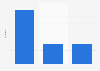
| Characteristic | Growth** |
|---|---|
| - | - |
| - | - |
| - | - |
The chart is not accessible to screen readers. Please switch to the table view to access the data.
Download
Source
Sources
Release date
October 2020
More information
Region
United States
Survey time period
2019 to 2020*
Supplementary notes
*The growth periods are defined as follows:
AptDeco: May 2020 to October 2020
NextDoor: August 2019 to August 2020
Facebook Marketplace: "over the last few months"
**The percentage change at Nextdoor refers to sales growth, at AptDeco and Facebook it refers to the number of listings. The figures for Facebook and AptDeco are rough estimates.
Citation formats