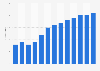
| Characteristic | Average taste score |
|---|---|
| - | - |
| - | - |
| - | - |
| - | - |
| - | - |
| - | - |
The chart is not accessible to screen readers. Please switch to the table view to access the data.
Download
Source
Source
Release date
December 2020
More information
Region
Australia
Survey time period
December 9, 2020
Number of respondents
30 respondents
Age group
18 years and older
Special properties
participants were choice.com staffers
Method of interview
Panel survey
Supplementary notes
Survey included 30 participants and six non-alcoholic beers. In total, 180 samples were tasted and rated, and an average taste score was calculated for each beer.
Taste scores:
"Love" - 100
"Like" - 75
"Dislike" - 25
Citation formats