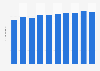
| Characteristic | House price to income ratio |
|---|---|
| - | - |
| - | - |
| - | - |
| - | - |
| - | - |
| - | - |
| - | - |
| - | - |
| - | - |
| - | - |
The chart is not accessible to screen readers. Please switch to the table view to access the data.
October 2024
Japan
2014 to 2023
The ratio was calculated by dividing the average price* for new private detached houses offered for sale by the average annual income**.
*Average price for detached houses for sale in Tokyo, Kanagawa, Chiba, Saitama Prefectures, and the southern part of Ibaraki Prefecture.
**From 2018 onwards, the annual income is the average annual income of working households in the Kanto region (Gunma, Tochigi, Ibaraki, Saitama, Tokyo, Chiba, and Kanagawa Prefectures).
Until 2017, the figures are based on the annual income of working households in the Kanto Major Metropolitan Areas (central cities and surrounding areas of Gunma, Tochigi, Ibaraki, Saitama, Tokyo, Chiba, Kanagawa, Shizuoka, and Yamanashi Prefectures). From 2020 onwards, figures are based on the price to income ratio of respondents in the Flat 35 User Survey.