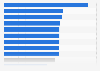
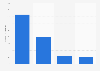
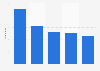
| Characteristic | Coworking footprint in million square feet |
|---|---|
| - | - |
| - | - |
| - | - |
| - | - |
| - | - |
| - | - |
| - | - |
| - | - |
| - | - |
| - | - |
| - | - |
| - | - |
| - | - |
| - | - |
| - | - |
| - | - |
| - | - |
| - | - |
| - | - |
| - | - |
| - | - |
| - | - |
| - | - |
| - | - |
| - | - |
| - | - |
| - | - |
| - | - |
| - | - |
The chart is not accessible to screen readers. Please switch to the table view to access the data.
Download
Source
Sources
Release date
August 2020
More information
Region
North America, Central and South America
Survey time period
Q2 2020
Supplementary notes
Northern California includes Oakland, Sacramento, SF, SF North Bay, San Mateo County and San Jose/Silicon Valley.
Chicago includes CBD only.
Greater Seattle includes Puget Sound.
Philadelphia refers to City of Philadelphia.
Buenos Aires and Lima refer to Class A.
Citation formats