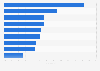
| Characteristic | Inflation rate |
|---|---|
| - | - |
| - | - |
| - | - |
| - | - |
| - | - |
| - | - |
| - | - |
| - | - |
| - | - |
| - | - |
| - | - |
| - | - |
| - | - |
The chart is not accessible to screen readers. Please switch to the table view to access the data.
September 2020
United Kingdom
July 2019 to July 2020
FPI is the CGA Prestige Foodservice Price Index, which measures the trend in food and beverage prices within the UK hospitality and foodservice sector.
The source provides the following definitions:
Index: The Index number is a figure reflecting the current cost of basket compared with the base cost of basked which started in 2015. The base value has an index number of 100, meaning that if the current Index for a category is 101, the cost of items in this category is now 1% higher than it was in 2015.
Inflation: Inflation is the % change in the Index. This is measured by both monthly and annual movements. For example:
Meat & Poultry Index January 2018: 97
Meat & Poultry Index January 2019: 102
To work out the inflation between the two datasets: (102-97)/97 = 0.052 = 5.2%
The difference between the base position of 100 and the current Index number is not necessarily the inflation number. Inflation is either measured year-on-year or month-on-month, whereas the Index is always measured against the base position of 100 set in 2015.
The figures assume no sudden departure from the EU without a deal.