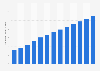
| Characteristic | 2018 | 2019 | Q1 2020 YTD | Q2 2020 YTD |
|---|---|---|---|---|
| - | - | - | - | - |
| - | - | - | - | - |
| - | - | - | - | - |
| - | - | - | - | - |
| - | - | - | - | - |
| - | - | - | - | - |
| - | - | - | - | - |
| - | - | - | - | - |
| - | - | - | - | - |
| - | - | - | - | - |
| - | - | - | - | - |
| - | - | - | - | - |
| - | - | - | - | - |
| - | - | - | - | - |
| - | - | - | - | - |
| - | - | - | - | - |
Download
Source
Source
Release date
September 2020
More information
Region
Europe
Survey time period
2018 to 2020
Special properties
The numbers provided come from various sources, but note that data availability varies per country; Numbers for Greece and Romania concern all property types, not just residential.
Supplementary notes
For this statistic, figures were combined from various domestic sources, such as:
- Belgium: ;
- Denmark: ;
- Finland: ;
- France: ;
- Germany: ;
- Greece: ;
- Hungary: ;
- Italy: ;
- Netherlands: ;
- Norway: ;
- Poland: ;
- Portugal: ;
- Romania: ;
- Spain: ;
- Sweden: ;
- United Kingdom: .
Citation formats