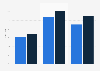
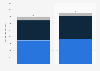


| Characteristic | In operation | Implementing | Planning | N/A |
|---|---|---|---|---|
| Intrusion detection | 61.1% | 18.9% | 13% | 5.4% |
| Vulnerability management | 52.4% | 22.8% | 14.3% | 8.2% |
| Platform health monitoring and support | 51.2% | 19.9% | 14.8% | 11.5% |
| Audit/ Assessment | 39.1% | 18.7% | 19.7% | 20.5% |
| Malware analysis | 38.6% | 17.1% | 18.2% | 25.1% |
| Data protection and monitoring | 38.4% | 25.3% | 24.6% | 10% |
| Asset and inventory management | 36.6% | 26.9% | 22.8% | 13% |
| Compliance support | 33% | 22.3% | 23.5% | 19.9% |
| Forensics/ E-discovery collection | 28.6% | 17.6% | 27.1% | 24.3% |
| Cyber threat integration | 28.1% | 26.9% | 26.3% | 17.6% |
| Initiate and manage IR | 27.6% | 26.6% | 27.9% | 15.3% |
| Threat hunting | 25.6% | 24.8% | 26.1% | 22% |
| Command function (IR/Analysis) | 23.5% | 29.7% | 28.9% | 15.1% |
| Security posture assessment with a breach attack simulation tool | 17.6% | 15.3% | 27.1% | 38.4% |
| Other | 2% | 1.8% | 3.3% | 25.1% |
The chart is not accessible to screen readers. Please switch to the table view to access the data.
Loading statistic...
Download
Source
Sources
Release date
May 2020
More information
Region
Worldwide
Survey time period
2020
Number of respondents
520 respondents
Special properties
security professionals
Citation formats



