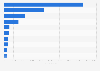
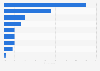
| Characteristic | 16-24 years | 25-34 years | 35-44 years | 45-54 years | 55+ years |
|---|---|---|---|---|---|
| - | - | - | - | - | - |
| - | - | - | - | - | - |
| - | - | - | - | - | - |
| - | - | - | - | - | - |
| - | - | - | - | - | - |
The chart is not accessible to screen readers. Please switch to the table view to access the data.
Download
Source
Source
In cooperation with
Rakuten Insight
Release date
May 2023
More information
Region
South Korea
Survey time period
April 13 to 30, 2023
Number of respondents
6,327 respondents
Age group
16 years and older
Method of interview
Online survey
Supplementary notes
Original question: "For which mealtimes do you usually order from food delivery apps?"
Multiple answers were possible.
Respondents count by age bracket were as follows:
16-24 years: 355
25-34 years: 1,399
35-44 years: 2,000
45-54 years: 1,613
55+ years: 960
Citation formats