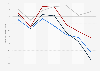
| Characteristic | Year-on-year percentage change |
|---|---|
| - | - |
| - | - |
| - | - |
| - | - |
| - | - |
| - | - |
| - | - |
| - | - |
| - | - |
| - | - |
| - | - |
| - | - |
| - | - |
| - | - |
| - | - |
| - | - |
| - | - |
The chart is not accessible to screen readers. Please switch to the table view to access the data.
Download
Source
Source
Release date
October 2020
More information
Region
Netherlands
Survey time period
March to October 2020
Special properties
Data based on monitoring the amount of smartphone Wi-Fi signals within designated shopping areas across the Netherlands.
Supplementary notes
* Data for weeks 22, 27 and 28 and 30-39 was not provided by the source.
The figures have been taken from several publications.
Citation formats