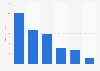
| Characteristic | Profitability index |
|---|---|
| - | - |
| - | - |
| - | - |
| - | - |
| - | - |
| - | - |
| - | - |
| - | - |
| - | - |
| - | - |
| - | - |
| - | - |
| - | - |
| - | - |
| - | - |
| - | - |
| - | - |
| - | - |
| - | - |
| - | - |
| - | - |
| - | - |
| - | - |
| - | - |
| - | - |
| - | - |
| - | - |
| - | - |
| - | - |
| - | - |
| - | - |
| - | - |
| - | - |
| - | - |
| - | - |
| - | - |
| - | - |
The chart is not accessible to screen readers. Please switch to the table view to access the data.
July 2025
China
Q2 2016 to Q2 2025
5,000 respondents
among industrial enterprises (excluding enterprises from Tibet)
Online survey
A diffusion index reflects entrepreneurs鈥� judgment on the profitability of the firms compared with the previous quarter. The index is derived by calculating the proportions of entrepreneurs who considered 鈥減rofits increased or losses reduced鈥� and that 鈥渂oth profits and losses remained unchanged鈥�, assigning weights 1 and 0.5 to them respectively, and adding up the multiplication results.
Figures in this statistic were rounded to one decimal place. Possible discrepancies between year-on-year or quarter-on-quarter changes calculated from the figures and those published in the report were mainly due to rounding.