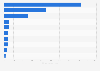
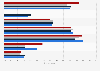
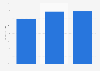
| Characteristic | Share of respondents |
|---|---|
| - | - |
| - | - |
| - | - |
| - | - |
The chart is not accessible to screen readers. Please switch to the table view to access the data.
May 2020
Russia
March 19-25, 2020
1,624 respondents**
18 years and older
Face-to-face interview
* The given question was asked only among respondents who had containers for separate waste collection installed near their homes.
** Refers to the total number of respondents, not only with separate waste collection installed.
Respondents representing urban and rural population were surveyed in 137 localities in 50 federal subjects of Russia.
The source specified the following information: the statistical error for a sample of 1,600 (with a probability of 0.95) does not exceed 3.4% for indicators close to 50%, 2.9% for indicators close to 25% / 75%, 2.0% for indicators close to 25% / 75%, 2.0% for indicators close to 10% / 90%, 1.5% for indicators close to 55% / 95%.