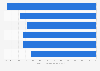
| Characteristic | Reduction in emissions |
|---|---|
| - | - |
| - | - |
| - | - |
| - | - |
| - | - |
| - | - |
| - | - |
| - | - |
| - | - |
| - | - |
| - | - |
| - | - |
| - | - |
| - | - |
| - | - |
| - | - |
| - | - |
| - | - |
| - | - |
| - | - |
The chart is not accessible to screen readers. Please switch to the table view to access the data.
Download
Source
Sources
Release date
April 2020
More information
Region
Europe
Survey time period
April 1 to 30, 2020
Supplementary notes
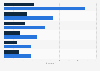
*Weather-corrected and population-weighted values.
The source adds the following information: "Differences between measured air pollutant concentrations and levels predicted based on weather conditions and previous years鈥� air quality data, showing the estimated impact of the lockdown measures. The analysis is done on the station-level, including all government monitoring stations, and population-weighted averages are calculated for each country".
Citation formats