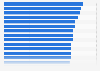
| Characteristic | Number of female dentists |
|---|---|
| California | 12,006 |
| Texas | 6,667 |
| New York | 5,422 |
| Florida | 4,953 |
| Illinois | 3,287 |
| New Jersey | 2,824 |
| Massachusetts | 2,521 |
| Pennsylvania | 2,363 |
| Virginia | 2,226 |
| Michigan | 2,220 |
| North Carolina | 2,209 |
| Washington | 2,003 |
| Ohio | 1,915 |
| Georgia | 1,885 |
| Maryland | 1,845 |
| Colorado | 1,419 |
| Minnesota | 1,328 |
| Arizona | 1,208 |
| Wisconsin | 1,167 |
| Indiana | 1,099 |
| Tennessee | 998 |
| Connecticut | 969 |
| Missouri | 957 |
| Kentucky | 922 |
| Oregon | 909 |
| South Carolina | 848 |
| Louisiana | 762 |
| Alabama | 648 |
| Iowa | 607 |
| Oklahoma | 588 |
| Nevada | 583 |
| Kansas | 480 |
| Nebraska | 434 |
| Mississippi | 428 |
| District of Columbia | 343 |
| New Hampshire | 331 |
| Hawaii | 328 |
| Arkansas | 322 |
| West Virginia | 294 |
| New Mexico | 294 |
| Maine | 257 |
| Rhode Island | 183 |
| Utah | 181 |
| Alaska | 172 |
| Delaware | 159 |
| Montana | 153 |
| South Dakota | 151 |
| Idaho | 132 |
| North Dakota | 131 |
| Vermont | 113 |
| Wyoming | 60 |
The chart is not accessible to screen readers. Please switch to the table view to access the data.
Loading statistic...
Download
Source
Sources
Release date
November 2023
More information
Region
United States
Survey time period
2022
Supplementary notes
Release date represents the date figures were accessed.
The source adds the following information: "Professionally active dentists are defined by the ADA as those who are licensed as dentists, and determined to be not retired, not having a suspended dental licensed, living in the 50 states or District of Columbia, and as having a primary occupation of private practice, dental school/faculty staff member, armed forces, other federal services, state or local government employee, hospital staff dentist, graduate student/intern/resident, or other health/dental organization staff member."
Citation formats