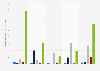
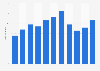
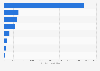
| Characteristic | Transaction volume in billion U.S. dollars |
|---|---|
| - | - |
| - | - |
| - | - |
| - | - |
| - | - |
| - | - |
| - | - |
| - | - |
| - | - |
| - | - |
| - | - |
The chart is not accessible to screen readers. Please switch to the table view to access the data.
Download
Source
Source
Release date
February 2020
More information
Region
Europe, United States
Survey time period
2009 to 2019
Supplementary notes
Completed and in 2019 announced trade sales of public and private U.S. and European biopharma companies, not including asset deals or purchase of divisions. Transaction volume including contingent payments. European numbers include Israel.
* Does not include 63 billion U.S. dollar sale not yet completed between AbbVie and Allergen.
Citation formats