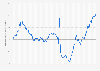
| Characteristic | Overall score |
|---|---|
| - | - |
| - | - |
| - | - |
| - | - |
| - | - |
| - | - |
| - | - |
| - | - |
| - | - |
| - | - |
The chart is not accessible to screen readers. Please switch to the table view to access the data.
Download
Source
Source
Release date
December 2019
More information
Region
United States
Survey time period
2019
Supplementary notes
The source analyzed the following factors in the 50 largest metro areas:
-Median home sale price-to-household income ration.
-Average loan-to-value ratio of homes sold in 2018.
-Home price volatility, measured by the standard deviation of home prices year-to-year.
-Share of home sales that are flips, i.e. sold twice within 12 months for a different price.
-Diversity of local employment, measured as the probability that any two randomly selected workers are in the same field.
-Share of the local economy dependent on exports.
-Share of local households headed by someone age 65 or older.
Citation formats