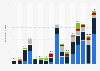
| Characteristic | Cost in billion CPI-adjusted U.S. dollars |
|---|---|
| Hurricane Harvey (2017) | 130 |
| Hurricane Maria (2017) | 93.6 |
| Superstorm Sandy (2012) | 73.5 |
| Hurricane Irma (2017) | 52 |
| Heat/drought (2012) | 33.9 |
| Hurricane Michael (2018) | 25.2 |
| Camp Fire, others (2018) | 24.5 |
| Hurricane Florence (2018) | 24.5 |
| Tubbs Fire, others (2017) | 18.7 |
| Hurricane Irene (2011) | 15.7 |
| Southern Plains drought (2011) | 13.9 |
| Southeast, Midwest storms (2011) | 11.9 |
| Western/Plains drought (2013) | 11.6 |
| Louisiana flooding (2016) | 10.8 |
| Hurricane Matthew (2016) | 10.8 |
| Missouri River flooding (2019) | 10.8 |
| Midwest storms (2011) | 10.6 |
| Mississippi River flooding (2019) | 6.2 |
| Tropical Storm Imelda (2019) | 5 |
| Western drought (2015) | 4.9 |
| Alaska and California wildfires (2019) | 4.5 |
| Central/Midwest severe weather (2019) | 4.5 |
| Arizona storms (2010) | 4.5 |
| Western drought (2014) | 4.4 |
| Rockies/Midwest/Eastern storms (2014) | 4.1 |
The chart is not accessible to screen readers. Please switch to the table view to access the data.
Loading statistic...
Download
Source
Sources
Release date
January 2020
More information
Region
United States
Survey time period
2010 to 2019
Citation formats