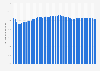
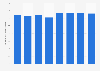
| Characteristic | Number of students per computer |
|---|---|
| - | - |
| - | - |
| - | - |
| - | - |
| - | - |
| - | - |
| - | - |
| - | - |
| - | - |
| - | - |
| - | - |
| - | - |
| - | - |
| - | - |
| - | - |
| - | - |
| - | - |
| - | - |
| - | - |
| - | - |
| - | - |
| - | - |
The chart is not accessible to screen readers. Please switch to the table view to access the data.
Download
Source
Source
Release date
March 2019
More information
Region
Europe
Survey time period
November 17, 2017 to May 25, 2018
Number of respondents
84,919 respondents
Special properties
Headteachers, teachers, parents and students
Supplementary notes
Data is based on 84,919 completed interviews with headteachers, teachers, parents and students across 31 different European countries.
Citation formats