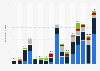
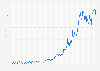
| Characteristic | Estimated losses in billion U.S. dollars |
|---|---|
| Hurricane Ian (Sep 2022) | 100 |
| Hurricane Maria (Sep 2017) | 68.6 |
| Hurricane Sandy (Oct 2012) | 68.4 |
| Hurricane Irma (Sep 2017) | 60.6 |
| Other relevant events since 2018 | - |
| Hurricane Michael (Aug 2018) | 16 |
| Hurricane Dorian (Aug-Sep 2019) | 5.6 |
| Hurricane Isaias (Jul-Aug 2020) | 5.4 |
The chart is not accessible to screen readers. Please switch to the table view to access the data.
January 2023
Latin America and the Caribbean
between 2000 and 2022
in current prices
The affected areas were:
Hurricane Maria (Sept 2017): Puerto Rico, Virgin Islands (U.S.), Dominica, Guadeloupe, Dominican Republic, Martinique, and Haiti.
Hurricane Sandy (October 2012): United States, Cuba, Haiti, Bahamas, Canada, Jamaica, Dominican Republic, and Puerto Rico.
Hurricane Irma (Sept 2017): United States, Virgin Islands (U.S.), British Virgin Islands, Cuba, Saint Martin, Sint Maarten, Saint Barthelemy, Anguilla, Puerto Rico, Turks and Caicos Islands, Antigua and Barbuda, Bahamas, Bonaire, Sint Eustatius, Saba, Dominican Republic, Haiti, and Saint Kitts and Nevis.
Hurricane Michael (Aug 2018): United States and Cuba.
Hurricane Dorian (Aug-Sep 2019): Caribbean and United States.
Hurricane Isaias (Jul-Aug 2020): North America and the Caribbean.
Hurricane Ian (Sept 2022): Cuba and United States.
Data for 2018, 2019, and 2022 was taken from previous releases of the NatCatService - Naturkatastrophen Factsheet.
Data prior to 2018 was retrieved from the database.
Figures have been rounded.