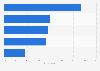
| Characteristic | Share of respondents |
|---|---|
| - | - |
| - | - |
| - | - |
| - | - |
| - | - |
| - | - |
| - | - |
The chart is not accessible to screen readers. Please switch to the table view to access the data.
Download
Source
Sources
Release date
April 2019
More information
Region
United States
Survey time period
December 2018 to January 2019
Number of respondents
3,120 respondents
Special properties
Luxury consumers respondents from 10 countries who had purchased second-hand luxury items*
Supplementary notes
*The source does not provide a breakdown of number of respondents by country.
Citation formats