| Characteristic | Share of respondents |
|---|---|
| - | - |
| - | - |
| - | - |
| - | - |
| - | - |
| - | - |
| - | - |
| - | - |
| - | - |
| - | - |
| - | - |
| - | - |
| - | - |
| - | - |
| - | - |
| - | - |
| - | - |
| - | - |
| - | - |
| - | - |
The chart is not accessible to screen readers. Please switch to the table view to access the data.
August 2019
Serbia
May 24 to June 7, 2019
Over 500**
Online survey
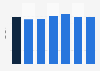
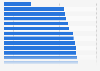
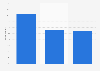
* The results show the share of respondents saying "Does or could give me greatest happiness" for the top 20 sources globally. The response alternatives were as follows: "Does or could give me greatest happiness, does or could give me some happiness, doesn't or couldn't make me happy or happier, does not apply to me."
** The source adds that the online sample for Serbia is not representative of the general adult population, but of a more urban, more educated and/or more affluent than the general population and the results should be viewed as reflecting the views of a more "connected" population."