| Characteristic | Share of respondents |
|---|---|
| - | - |
| - | - |
| - | - |
| - | - |
The chart is not accessible to screen readers. Please switch to the table view to access the data.
Download
Source
Source
Release date
August 2019
More information
Region
India
Survey time period
May 24 to June 7, 2019
Number of respondents
500+
Age group
16-74 years old
Method of interview
Online survey
Supplementary notes
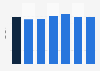
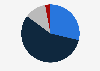
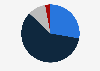
The question asked was as follows: "Taking all things together, would you say you are: Very happy, rather happy, not very happy, not happy at all?"
According to the source, respondents were more urban and educated, with higher incomes than their fellow citizens. As such, the results should be viewed as reflecting the views of a more 'connected population'.
Citation formats