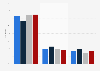
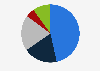
| Characteristic | Share of responsibility* |
|---|---|
| - | - |
| - | - |
| - | - |
| - | - |
| - | - |
The chart is not accessible to screen readers. Please switch to the table view to access the data.
Download
Source
Source
Release date
February 2019
More information
Region
Italy
Survey time period
October 17 to November 2, 2018
Number of respondents
1,000 respondents
Method of interview
Online survey
Supplementary notes
* Percentages show amount of responsibility that people in different countries, on average, think each of the below groups should bear for the situation of retired people.
Citation formats