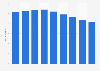
| Characteristic | Retail sales in thousand Canadian dollars |
|---|---|
| - | - |
| - | - |
| - | - |
| - | - |
| - | - |
| - | - |
| - | - |
| - | - |
| - | - |
| - | - |
| - | - |
| - | - |
| - | - |
| - | - |
| - | - |
| - | - |
| - | - |
| - | - |
| - | - |
| - | - |
The chart is not accessible to screen readers. Please switch to the table view to access the data.
Download
Source
More information
Region
Canada
Survey time period
December 2018 to July 2020
Supplementary notes
*Figures for October and November of 2018 suppressed by the source to meet the confidentiality requirements of the Statistics Act.
Figures are presented in unadjusted form as there is no seasonal pattern established by official statistics yet.
Figures have been rounded.
To access data, please select North American Industry Classification System (NAICS) - Miscellaneous store retailers - Cannabis stores.
Adapted from Statistics Canada, statcan.gc.ca, December 2018 to July 2020. This does not constitute an endorsement by Statistics Canada of this product.
Citation formats