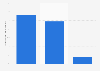
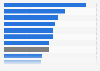
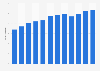
| Characteristic | Percentage increase in health expenditure |
|---|---|
| - | - |
| - | - |
| - | - |
| - | - |
| - | - |
| - | - |
| - | - |
| - | - |
| - | - |
| - | - |
| - | - |
The chart is not accessible to screen readers. Please switch to the table view to access the data.
Download
Source
Source
Release date
July 2019
More information
Region
Canada
Survey time period
2009 to 2010 and 2017 to 2018
Supplementary notes
The total MHA services expenditure for fiscal years 2009鈥�2010 and 2017鈥�2018 was calculated using direct costs reported in the Canadian MIS Database.
Data is not available for Quebec and Nunavut in the Canadian MIS Database. Data is not available for community care in Yukon.
Physician compensation was excluded from the analysis and spending on MHA could be underestimated.
Citation formats