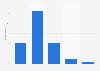
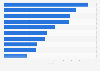
| Characteristic | Share of respondents |
|---|---|
| - | - |
| - | - |
| - | - |
The chart is not accessible to screen readers. Please switch to the table view to access the data.
Download
Source
Sources
Release date
June 2019
More information
Region
United States
Survey time period
May 31 to June 2, 2019
Number of respondents
2,201 respondents
Age group
18 years and older
Method of interview
Online survey
Supplementary notes
The question was phrased by the source as follows: 'If you had to choose, would you rather watch a utopian movie or TV show, in which characters are living in a near-perfect society, or a dystopian movie or TV show, in which characters are living in a society of great suffering or injustice?'
Citation formats