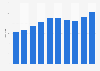
| Characteristic | Number of stations |
|---|---|
| - | - |
| - | - |
| - | - |
| - | - |
| - | - |
| - | - |
| - | - |
| - | - |
| - | - |
| - | - |
| - | - |
| - | - |
| - | - |
| - | - |
| - | - |
| - | - |
| - | - |
| - | - |
| - | - |
| - | - |
The chart is not accessible to screen readers. Please switch to the table view to access the data.
Download
Source
Sources
Release date
May 2020
More information
Region
United States
Survey time period
2020
Supplementary notes
The companies included in this statistic are based on a ranking that measures the "market efficiency" of gas station companies, which the source(s) define as "market share divided by outlet share". The source further adds that "[a] higher market efficiency indicates stores with higher volumes, with an average market efficiency of 1." Therefore, some companies with lower market efficiency may have been excluded from this chart.
Citation formats