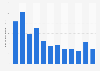
| Characteristic | Share of respondents |
|---|---|
| - | - |
| - | - |
| - | - |
| - | - |
| - | - |
| - | - |
| - | - |
| - | - |
The chart is not accessible to screen readers. Please switch to the table view to access the data.
Download
Source
Source
More information
Number of respondents
2,094 respondents
Age group
18-64 years
Supplementary notes
The question was phrased as follows: "How many hours per week do you spend using the following services?".
Citation formats