

| Characteristic | Top performers | Typical performers | Trailing performers |
|---|---|---|---|
| - | - | - | - |
| - | - | - | - |
| - | - | - | - |
| - | - | - | - |
| - | - | - | - |
| - | - | - | - |
| - | - | - | - |
| - | - | - | - |
| - | - | - | - |
| - | - | - | - |
| - | - | - | - |
| - | - | - | - |
| - | - | - | - |
| - | - | - | - |
| - | - | - | - |
| - | - | - | - |
| - | - | - | - |
The chart is not accessible to screen readers. Please switch to the table view to access the data.
Download
Source
Source
Release date
October 2018
More information
Region
Worldwide
Survey time period
2018
Number of respondents
Top performers (n=230), typical performers (n=2,329), trailing performers (n=276)
Special properties
CIOs
Supplementary notes
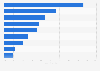
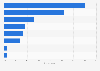
This question was phrased by the source as follows: "Which technology area do you expect will be a game changer for your organization?"
Multiple responses allowed, coded open-text responses
Citation formats



