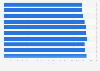
| Characteristic | Average score |
|---|---|
| - | - |
| - | - |
| - | - |
| - | - |
| - | - |
The chart is not accessible to screen readers. Please switch to the table view to access the data.
Download
Source
Source
Release date
May 2019
More information
Region
Colombia
Survey time period
October 16 to December 21, 2018
Number of respondents
89,522 households
Age group
15 year or more
Method of interview
Face-to-face interview
Supplementary notes
* Calculated using only people that received income.
More information regarding the survey`s methodology can be found .
The score goes from 0 to 10, where 0 means "totally unsatisfied" and 10 means "totally satisfied"
Citation formats