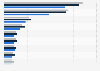
| Characteristic | 2015 | 2016 |
|---|---|---|
| - | - | - |
| - | - | - |
| - | - | - |
| - | - | - |
| - | - | - |
| - | - | - |
| - | - | - |
| - | - | - |
| - | - | - |
| - | - | - |
| - | - | - |
| - | - | - |
| - | - | - |
| - | - | - |
| - | - | - |
| - | - | - |
The chart is not accessible to screen readers. Please switch to the table view to access the data.
Download
Source
Sources
Release date
October 2018
More information
Region
Belgium
Survey time period
2015 and 2016
Supplementary notes
* Missing percentage points to 100 percent in 2016 are due to a double entry in the source. The source mentions "IBM Belgium Financial Services Company" twice, with a market share of both 2.4 percent and 2.1 percent. The source does not explain this, so the second entry has been omitted.
The figures have been taken from several publications.
Citation formats