| Characteristic | Sales in million U.S. dollars |
|---|---|
| - | - |
| - | - |
| - | - |
| - | - |
| - | - |
| - | - |
| - | - |
| - | - |
| - | - |
| - | - |
| - | - |
| - | - |
| - | - |
| - | - |
| - | - |
| - | - |
| - | - |
| - | - |
| - | - |
| - | - |
The chart is not accessible to screen readers. Please switch to the table view to access the data.
July 2018
Worldwide
2017
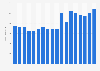
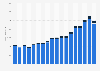
* The 2017 annual reports of prime industry players were the main source of data for the figures in this analysis. The monetary values were converted to dollars at the exchange rate listed on the last day of the fiscal year. Data from Monsanto, Bayer, DuPont Pioneer, Dow AgroSciences, RAGT Semences,
Euralis Semences, and InVivo provided the seed sales value of the year; data from Limagrain: without IFRS11 impact, excluding Garden products; and data from all other companies were used to indicate sales value per company within the fiscal year. (Source of exchange rate from PoundSterling Live).
Companies with absent values in this graph had not provided sales data for 2017. Their placements within the ranking are based on their 2016 ranking.