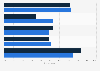
| Characteristic | Share of respondents |
|---|---|
| - | - |
| - | - |
| - | - |
| - | - |
| - | - |
| - | - |
| - | - |
The chart is not accessible to screen readers. Please switch to the table view to access the data.
Worldwide
2018
651 respondents
Online survey
Data is based on the answers from shippers and 3PLs in North America
(67 percent), Asia (13 percent) and Europe (9 percent).
About 22 percent of respondents were from manufacturing, 17 percent from retail and consumer products, 11 percent from the food and beverage industry, ten percent from health care and pharmaceutical companies, eight percent from the automotive industry, six percent of respondents were from business support and logistics, four percent were from the telecommunications, technology, internet and electronics industry, three percent from airlines, aerospace and defense, three percent from construction and machinery, two percent from governmental companies, one percent from finance, insurance and real estate, one percent from the utilities, energy and extraction industry, and 12 percent from others.
The source did not specify the age of the respondents.
Multiple answers were possible.