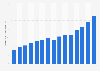
| Characteristic | Year-on-year change in turnover |
|---|---|
| - | - |
| - | - |
| - | - |
| - | - |
| - | - |
| - | - |
| - | - |
| - | - |
| - | - |
| - | - |
| - | - |
| - | - |
| - | - |
| - | - |
The chart is not accessible to screen readers. Please switch to the table view to access the data.
Download
Source
Source
Release date
April 2024
More information
Region
Russia
Survey time period
2010 to 2023
Supplementary notes
*Excluding statistical information on the Donetsk People's Republic (DPR), Luhansk People's Republic (OSR), Zaporozhye and Kherson regions.
The physical volume of turnover refers to the aggregate change in goods over the period under consideration compared to the previous period and shows how the turnover changed only based on the change of its physical volume, excluding the influence of price changes.
Citation formats