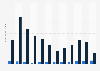
| Characteristic | Value in million U.S. dollars |
|---|---|
| - | - |
| - | - |
| - | - |
| - | - |
| - | - |
| - | - |
| - | - |
The chart is not accessible to screen readers. Please switch to the table view to access the data.
Download
Source
More information
Region
Central and South America, Peru
Survey time period
2012 to 2018
Supplementary notes
* Figures prior to 2015 come from previous reporting.
Data refers to fruit juices (including grape must) and vegetables juices, unfermented, not containing added spirit; whether or not containing added sugar or other sweetening matter.
The source does not provide the exact publication date. The given date is the date of access.
Figures have been rounded.
Citation formats