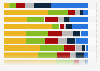
| Characteristic | 2017 | 2018 | 2019 | 2020 | 2021 | 2022 | 2023 |
|---|---|---|---|---|---|---|---|
| - | - | - | - | - | - | - | - |
| - | - | - | - | - | - | - | - |
| - | - | - | - | - | - | - | - |
| - | - | - | - | - | - | - | - |
| - | - | - | - | - | - | - | - |
| - | - | - | - | - | - | - | - |
| - | - | - | - | - | - | - | - |
The chart is not accessible to screen readers. Please switch to the table view to access the data.
Download
Source
Source
Release date
March 2024
More information
Region
North America
Survey time period
2017 to 2023
Special properties
building service contractors/commercial cleaning providers
Method of interview
Email survey
Supplementary notes
The source does not provide any information regarding missing percentage points to 100 percent.
This question was phrased by the source as follows: "Which of the following areas/surfaces do you receive the most complaints about from your customers?"
Citation formats