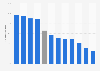
| Characteristic | Generation output in terawatt hours |
|---|---|
| - | - |
| - | - |
| - | - |
| - | - |
| - | - |
| - | - |
| - | - |
| - | - |
| - | - |
| - | - |
| - | - |
| - | - |
| - | - |
| - | - |
| - | - |
| - | - |
| - | - |
| - | - |
| - | - |
| - | - |
| - | - |
| - | - |
| - | - |
| - | - |
| - | - |
| - | - |
| - | - |
| - | - |
| - | - |
| - | - |
| - | - |
| - | - |
| - | - |
| - | - |
| - | - |
The chart is not accessible to screen readers. Please switch to the table view to access the data.
Download
Source
Source
Release date
July 2018
More information
Region
United Kingdom
Survey time period
2017
Supplementary notes
* Steady state projections. The source adds the following information: "Steady State is a world of 鈥榖usiness as usual鈥�. The focus is on security of supply and low costs for consumers. This is also the least affluent scenario and the least green"
Citation formats